|
KLIPPEL ANALYZER SYSTEM Linear Parameter Measurement (LPM) Using Fixed Mmd Method |
|
|

|
Driver
Name: |
SS 9 |
|
Driver
Comment: |
|
|
Measurement: |
LPM
subwoofer Fixed Mmd |
|
Measurement
Comment: |
|
|
Date: |
07/21/07 |
|
Time: |
19:37:16 |
Comments
Measured BL was lower than included
datasheet. Data gives 11.67 measured value is 10.37. Note that Klipple measurement does correlate with the Scan-Speak
frequency response sensitivity of 80.2 @2.83 volts.
MEASUREMENT TECHNIQUE
A paper detailing the
measurement methods used can be found at: Fast
and Accurate Linear Parameter Measurement
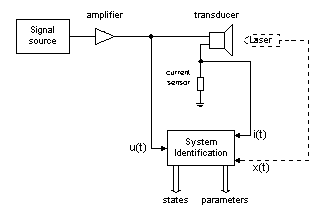
Testing on the woofer was
performed using the Fixed Mmd method. This yields by
far the most accurate results for compliance values. The measurement module
identifies the electrical and mechanical parameters (Thiele-Small parameters)
of electro-dynamical transducers. The electrical parameters are determined by
measuring terminal voltage u(t) ![]() and current i(t) and
exploiting the electrical impedance Z(f)=U(f)/I(f). Furthermore the suspension
creep of the driver is identified giving more accuracy of the loudspeaker model
at low frequencies.
and current i(t) and
exploiting the electrical impedance Z(f)=U(f)/I(f). Furthermore the suspension
creep of the driver is identified giving more accuracy of the loudspeaker model
at low frequencies.
Measurement Results
Linear electrical
and mechanical parameters
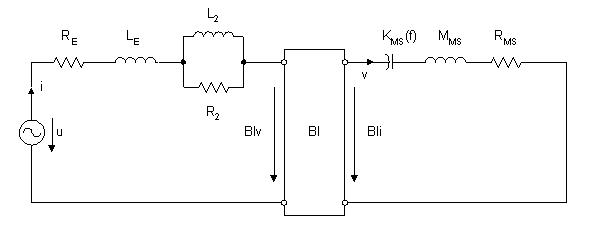
The measurement module
determines the components (Thiele-Small Parameters) of the linear loudspeaker
model below describing the small signal behaviour of the driver.
The table
below shows the electrical and mechanical parameters of the linear driver
model, the derived parameters (resonance frequency, loss factors etc.) and the
parameter of the suspension creep factor.
|
|
|||
|
Name |
Value |
Unit |
Comment |
|
Electrical Parameters |
|
|
|
|
Re |
6.10 |
Ohm |
electrical voice coil resistance at DC |
|
Krm |
0.0711 |
|
WRIGHT inductance model |
|
Erm |
0.38 |
|
WRIGHT inductance model |
|
Kxm |
0.0134 |
|
WRIGHT inductance model |
|
Exm |
0.64 |
|
WRIGHT inductance model |
|
Cmes |
997 |
µF |
electrical capacitance representing moving mass |
|
Lces |
32.73 |
mH |
electrical inductance representing driver compliance |
|
Res |
62.25 |
Ohm |
resistance due to mechanical losses |
|
fs |
27.9 |
Hz |
driver resonance frequency |
|
|
|||
|
Mechanical Parameters |
|
|
|
|
(fixed Mmd) |
|
|
|
|
Mms |
107.289 |
g |
mechanical mass of driver diaphragm assembly including air load and voice coil |
|
Rms |
1.729 |
kg/s |
mechanical resistance of total-driver losses |
|
Cms |
0.304 |
mm/N |
mechanical compliance of driver suspension |
|
Kms |
3.29 |
N/mm |
mechanical stiffness of driver suspension |
|
Bl |
10.37 |
N/A |
force factor (Bl product) |
|
|
|||
|
Loss factors |
|
|
|
|
Qtp |
1.043 |
|
total Q-factor considering all losses |
|
Qms |
10.865 |
|
mechanical Q-factor of driver in free air considering Rms only |
|
Qes |
1.064 |
|
electrical Q-factor of driver in free air considering Re only |
|
Qts |
0.969 |
|
total Q-factor considering Re and Rms only |
|
|
|||
|
Vas |
23.1708 |
l |
equivalent air volume of suspension |
|
n0 |
0.045 |
% |
reference efficiency (2 pi-radiation using Re) |
|
Lm |
78.76 |
dB |
characteristic sound pressure level (SPL at 1m for 1W @ Re) |
|
Lnom |
79.94 |
dB |
nominal sensitivity (SPL at 1m for 1W @ Zn) |
|
|
|||
|
rmse Z |
7.02 |
% |
root-mean-square fitting error of driver impedance Z(f) |
|
|
|||
|
Series resistor |
0.00 |
Ohm |
resistance of series resistor |
|
Mmd (fixed) |
105.290 |
g |
Mmd value specified by the user |
|
Sd |
232.00 |
cm² |
diaphragm area |
Suspension creep factor
Some loudspeaker suspension
materials exhibit significant creep (continued slow displacement under
sustained force) in their dynamic behaviour. Therefore the traditional
low-frequency loudspeaker model is expanded to incorporate suspension creep by
replacing the simple linear compliance by the dynamic transfer function [1].
where CMS is the linear compliance and ![]() fs
is the driver resonance frequency. There is a straight forward interpretation
of the creep factor
fs
is the driver resonance frequency. There is a straight forward interpretation
of the creep factor ![]() . The quantity
. The quantity ![]() 100% indicates the decrease of the
compliance CMS(fs) in
percentages at low frequencies. For a frequency one decade below the resonance
frequency fs the compliance CMS(fs) is decreased by
100% indicates the decrease of the
compliance CMS(fs) in
percentages at low frequencies. For a frequency one decade below the resonance
frequency fs the compliance CMS(fs) is decreased by ![]() 100% .
100% .
[1]
Knudsen, M. H. and Jensen, J. G. Low-frequency loudspeaker models that
include suspension creep. J. Audio
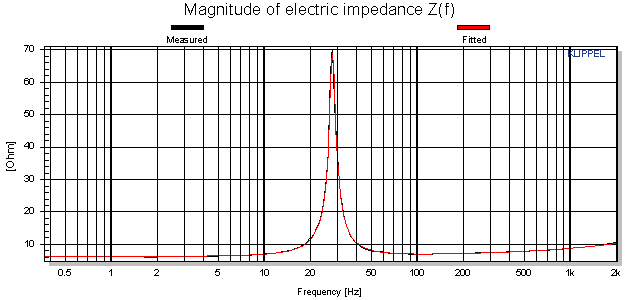
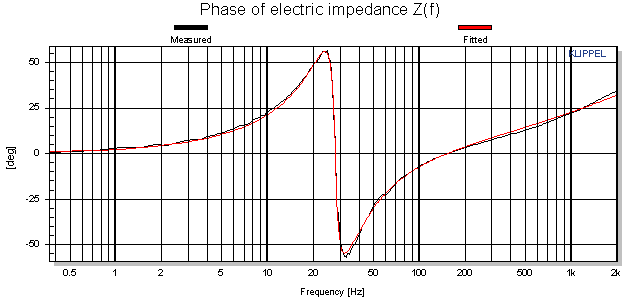
Electrical Impedance
The two figures below show
the magnitude and the phase response of the measured and estimated
transfer function Z(f)= U(f)/I(f) where
U is the terminal voltage and I is the current. The solid curve is the
ratio of the measured spectra U(f), I(f) while the thin curve is
the impedance of the linear driver equivalent circuit using the linear model
and the identified electrical parameters shown
Displacement Transfer
Function
The figure below shows the
magnitude of the measured and estimated transfer function Hx(f)= X(f)/U(f) between the voice coil displacement X and
the terminal
%20Magnitude.png)
Spectra of measurement signals
Voltage Spectrum
The diagram shows the
multi-tone spectrum of the voltage at the terminals. The blue lines represent the fundamental components
excited by the stimulus. The black noise floor lines represent the
residual measurement noise caused by the voltage sensor. If the grey noise + distortions exceeds the residual noise floor we see the distortions
generated by the nonlinearities of the power amplifier. This information is
important for assessing the distortion of the speaker in the current,
displacement and sound pressure below.
%20Spectrum.png)
Current Spectrum
The diagram below shows the
multi-tone spectrum of the current at the terminals. The red lines represent the fundamental components excited
by the stimulus. Note the notch of the spectrum at the resonance frequency of
the driver. The black noise floor lines indicate the residual noise
caused by the measurement system (current sensor). If the grey noise + distortions lines exceeds
the residual noise floor we see the distortions generated by the nonlinearities
of the speaker (assuming that the power amplifier is sufficiently linear).
%20Spectrum.png)
Displacement Spectrum
The diagram
below shows the multi-tone spectrum of the voice coil displacement measured
with the laser sensor. The violet lines represent the fundamental components excited by
the stimulus. Note the 12 dB/octave decay of the displacement spectra above the
resonance frequency of the laser. The black noise floor lines
indicate the measurement noise caused by the resolution of the used Laser
Sensor Head. Increasing the number of averaging will further reduce the
residual noise line. If the grey noise + distortions
exceeds the residual noise floor we see the distortions generated by the
nonlinearities of the speaker. These components are independent on the number
of averaging.
%20Spectrum.png)
Sound Pressure Spectrum
The diagram shows the multi-tone
spectrum of the sound pressure measured with the microphone. The green lines represent the fundamental components
excited by the stimulus.The black noise floor lines indicate the ambient noise during the
measurement. The grey noise + distortions
are the nonlinear
distortion components generated by the speaker.
%20Spectrum.png)
Signal
Characteristics
The table below summarizes important
statistical characteristics (peak values, head rooms, SNR ratio,
) of the
state variables (voltage, current, displacement and sound pressure). This
information is helpful for assessing the working point of the driver (Small -
Large Signal Domain) and to detect any malfunction operation (microphone or
laser not connected).
|
|
|||
|
Name |
Value |
Unit |
Comment |
|
HINT : |
|
|
Reduce Fmax to 20* fs to improve impedance fitting |
|
|
|||
|
U pp |
2.37 |
V |
peak to peak value of voltage at terminals |
|
U ac |
0.30 |
V rms |
AC part of voltage signal |
|
U dc |
-0.00 |
V |
|
|
U head |
47.2 |
dB |
digital headroom of voltage signal |
|
U SNR+D |
44.1 |
dB |
ratio of signal to noise+distortion in voltage signal |
|
fu noise |
1.1 |
Hz |
frequency of noise+distortion maximum in voltage signal |
|
|
|||
|
I pp |
0.28 |
A |
peak to peak value of current at terminals |
|
I ac |
0.04 |
A rms |
AC part of current signal |
|
I dc |
-0.00 |
A |
|
|
I head |
51.7 |
dB |
digital headroom of current signal |
|
I SNR+D |
21.4 |
dB |
ratio of signal to noise+distortion in current signal |
|
fi noise |
27.5 |
Hz |
frequency of noise+distortion maximum in current signal |
|
|
|||
|
X pp |
0.60 |
mm |
peak to peak value of displacement signal |
|
X ac |
0.09 |
mm rms |
AC part of displacement signal |
|
X dc |
0.02 |
mm |
|
|
X head |
50.2 |
dB |
digital headroom of displacement signal |
|
X SNR+D |
20.9 |
dB |
ratio of signal to noise+distortion in displacement signal |
|
fx cutoff |
77.3 |
Hz |
frequency of highest valid line in displacement signal |
|
|
|||
|
p pp |
0.02 |
mV |
peak to peak value of microphone signal |
|
p ac |
0.00 |
mV rms |
AC part of microphone signal |
|
p head |
111.0 |
dB |
digital headroom of microphone signal |
|
p sum level |
-11.4 |
dB |
sum level of microphone signal |
|
p mean level |
-49.4 |
dB |
mean level of microphone signal |
|
|
|||
|
f sample |
6000 |
Hz |
sample frequency |
|
N stim |
16384 |
number of samples |
stimulus length |