SpeaD 2026 · Spider
Spider Design
Nonlinear Suspension Modelling
A nonlinear corrugated spider model with multiple profile shapes, animated cross-section visualization, and F(x) / Kms(x) curves.
Corrugated spider modelling
The Spider module models a corrugated spider with highly accurate results. Inputs include inner and outer diameter, corrugation count, peak-to-valley height, cloth thickness, Young's modulus, loss factor, Poisson ratio (with a range of spider materials), and multiple profile shapes — sinusoidal, sinusoidal plus line extension, triangular, half-circular arcs, and circular arc with line extension.
All of these can be adjusted with slider-controlled height, taper%, and variable pitch (the last two for progressive spider designs), coupled with various neck configurations and basket attachment methods. The module delivers stiffness Kms, compliance Cms, Xmax, corrugation breakpoint displacement, pitch, and Force-Displacement and Kms(x) curves.
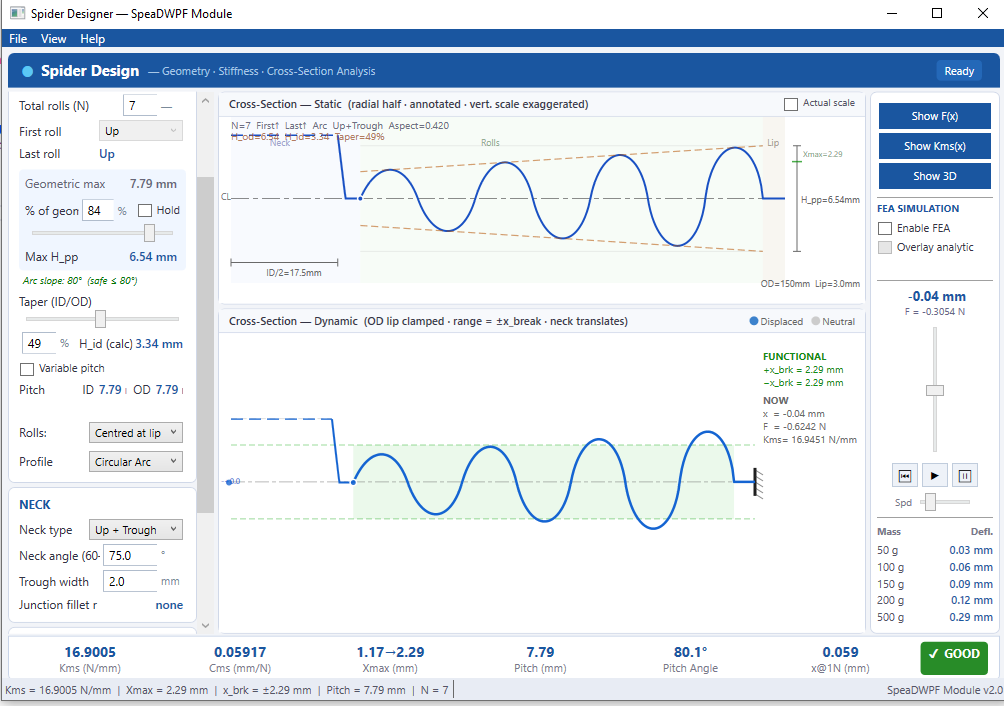
Static and dynamic visualization
The visualization is particularly thorough. A static cross-section shows the radial half-profile with full dimension annotations and exaggerated vertical scale to reveal corrugation detail. A dynamic cross-section animates the spider under excursion, with the OD lip clamped and the neck translating, allowing the designer to see exactly how each corrugation deforms through the full stroke.
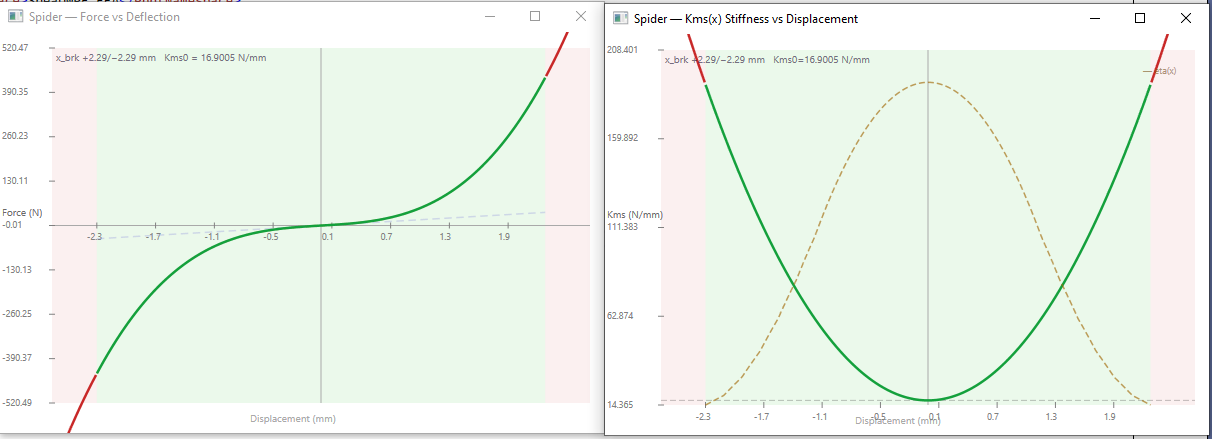
F(x) and Kms(x) curves
Popup charts show the nonlinear F(x) force-displacement curve with hysteresis envelope, and the Kms(x) stiffness curve color-coded by zone: the initial geometric stiffening region and the breakpoint knee.
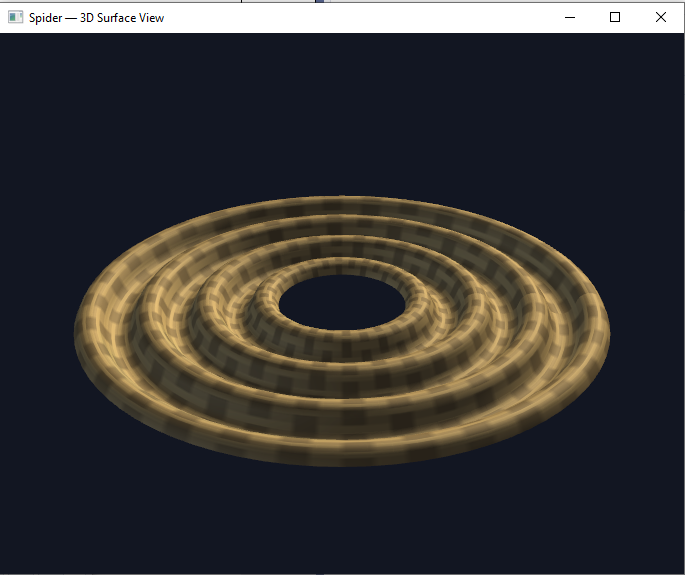
Animated 3D visualization
An animated 3D drawing can also be opened to show the spider's function through excursion.