SpeaD 1.0 · Nonlinear Curves
Nonlinear Curves
The large-signal curves that describe how the driver behaves away from rest, gathered on one page.
Predicted and measured, side by side
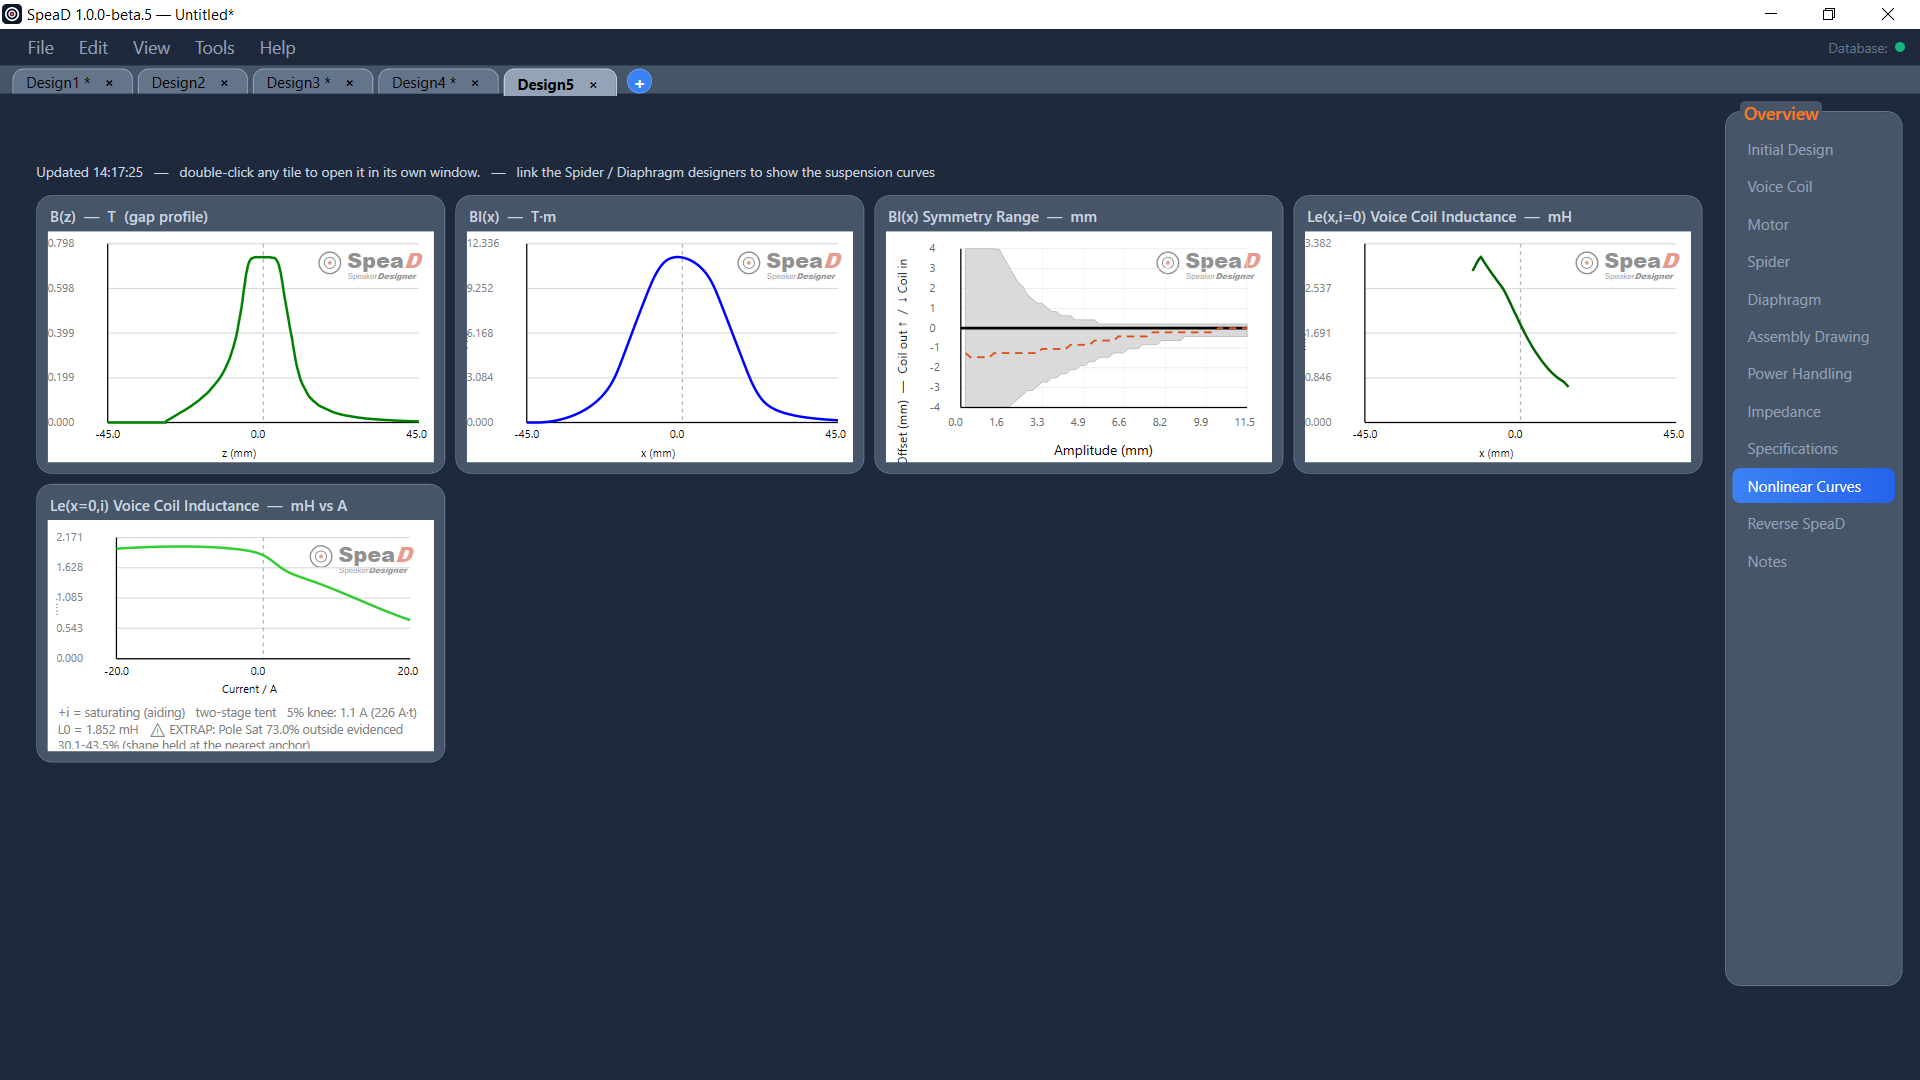
The Nonlinear Curves page shows the driver’s large-signal curves as tiles, in the same form Klippel LSI measurements present them, so predicted and measured drivers can be compared side by side. The page follows your edits, and double-clicking a tile opens it in its own window.
Motor curves
- B Profile — flux density along the gap axis at the gap radius.
- Bl(x) — force per ampere against displacement; its curvature sets Xmax10 and Xmax20.
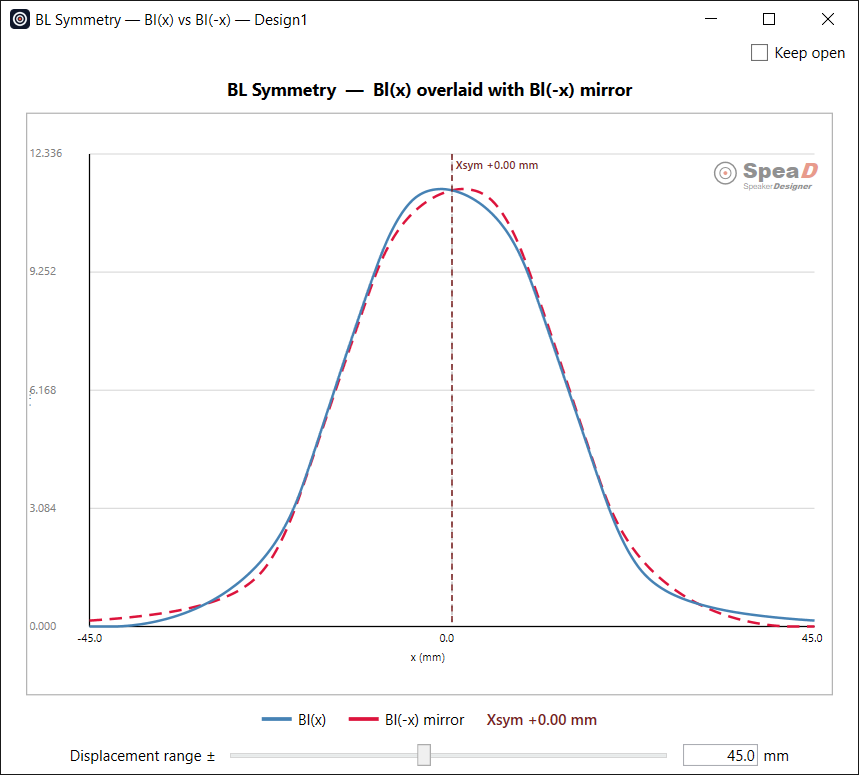
- Bl(x) Symmetry Range — the offset that would make Bl(x) symmetric, against amplitude.
- Le(x,i=0) — inductance against displacement.
- Le(x=0,i) — inductance against coil current.
Suspension curves
- Driver Kms(x) and Cms(x) — spider and surround combined.
- Spider Kms(x) and Surround Kms(x) — each part on its own.
- Kms(x) Symmetry Range.
- fs(x) and Qts(x) — resonance and total Q against displacement.
Read the Nonlinear Curves chapter of the SpeaD Owner’s Manual for every control on the page.